We built our own Product Analytics with Moose (pt. 1)
TL;DR:
- We wanted to measure a time series of user interactions on our website.
- We didn't trust the data from off-the-shelf product analytics, so we decided to build our own simple product analytics using Moose.
- You can too, checkout the Github repo
This post is the first in a series of blogs that will take you through how we developed new Moose framework primitives by using Moose to build our own Product Analytics application. We built the plane (the Moose framework) while flying it (using Moose for our own use cases), which taught us a ton about refining the core capabilities and development experience of our own product.
Without further ado: the new and improved Product Analytics Template, complete with all four Moose primitives (data models, flows, aggregations, and consumption APIs), is here and ready for you to use!
Keep reading for a walkthrough of the new features. You can also follow along with the GitHub repository.
A brief origin story… 📖
We wanted to understand how users interact with our platform to make it better. We started off by utilizing one of the many popular product analytics SaaS tools on the market, taking advantage of the "plug-and-play" convenience they have to offer.
We quickly ran into issues. Many industry-leading "self-serve" analytics SaaS tools share common problems:
- Multiple Sources of Truth: Multiple team members had their own dashboards with differing definitions for our key metrics. This often happens because the target users of these tools, typically not involved in data capture and processing, create their own metrics without a deep enough understanding of the underlying data sources.
- Unreliable Metrics: There is no transparency into how metrics are calculated. We experienced discrepancies in visitor counts over overlapping time periods with an industry-leading SaaS product, indicating a flaw in the metric calculation. Since the tool was closed source, we had no path to remediation or debugging.
We believe metrics should be transparent, and standardized in code as close to the data source as possible. That way the domain experts most familiar the data are the same folks defining the metrics.
So we put our own product to the test 🧪
We built our own product analytics application using Moose and shared the code. That’s how Moose templates were born, and why Product Analytics was our first project. These open-source sample applications are designed for you to customize and extend.
...and put the “minimum viable” in MVP (not “most valuable”)
Our first version of the template was...limited. If you've used it, you know this. The application includes two parts: a backend MooseJS data service and a NextJS frontend dashboard. The original version ingested event data from your web application to the Moose backend. The NextJS frontend then visualized these insights.
There were no Aggregations or Consumption APIs when we first built the template, so the frontend was directly connected to the database, using complex, ad-hoc queries to extract data. As you'll see in the later on, it was messy.
We refactored the analytics dashboard by migrating to Moose
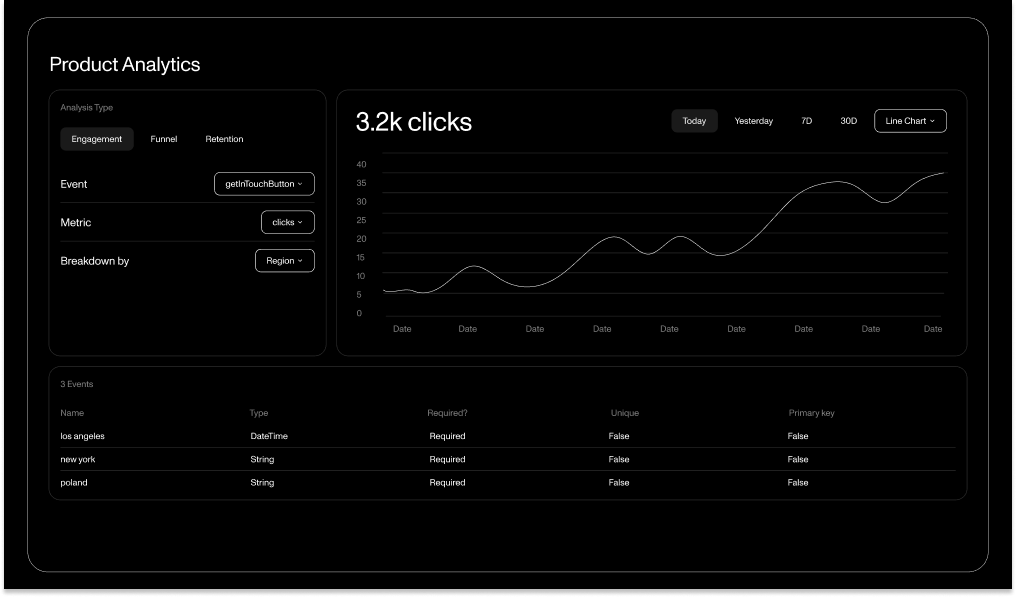
The dashboard UI may look the same as before, but now it’s powered by our newest Moose primitives. It visualizes overall performance indicators for how users interact with our website over time, including total browsing sessions, average session duration, total page views, and more. These are the metrics we turn to time and time again to measure the health of our website, so we want them to be fresh, consistently measured, and easily accessible.
A before and after
Let’s dive into the before and after for how we generated and fetched data for the main dashboard page of our frontend application. In our Moose application, we have a PageView event data model. Every time a page loads on our website, we capture data for that specific page view, sending it to Moose. Moose ingests and appends the record to the PageView table that it created for us in our database.
This table stores useful but granular information. We need to zoom out to answer broader questions like: How many page views did a user have during their browsing session? How long were they visiting our site? To answer these questions, we need to group all PageView records by the session_id they belong to, providing a better overview of each user's entire session.
This still doesn’t get us all the way to what we want to showcase on our dashboard. We want to zoom out even more to get the bigger picture across all of our sessions, not just a single session. So, we need to take our first transformation, which aggregates single page views into session summaries, and transform the data again to aggregate single session summaries into a time series.
Before: using Common Table Expressions (CTEs) in the frontend 🤢
CTEs are temporary query result sets used in chained SQL queries. In our old code, we used CTEs to assemble data for the time series charts on the main dashboard page. Our frontend code included functions to generate SQL statements for performing the two rollups, along with a helper function to chain them together, connect to our database, and execute the generated query.
Utility functions chained these queries together:
It worked, but we had to re-run the same sequence of aggregate queries every time we wanted to fetch our data. This would get slower as our data volume grows. Beyond performance, just look at that code– it's not exactly easy on the eyes. There had to be a better way.
After: the Aggregations primitive was born (and quickly adopted) 🙂
We designed aggregations to optimize how your most critical insights and metrics are calculated, stored, and accessed. This primitive lets you define and calculate your KPIs using plain SQL queries, while behind the scenes Moose saves these query results to your database and keeps them up to date at all times.
Here's how it works: Moose interprets your SQL query, a standard SELECT statement containing your business logic for transforming data from one or more of your existing tables. It then creates a new table in your database populated with the query results. Whenever new data is added to the existing tables, the new tables are automatically updated.
In our revamped template, we use an aggregation to create a sessions table, which rolls up our individual PageView event records into session overviews. Here's the code:
Aggregations on Aggregations…
With our sessions aggregation, we created a foundation of individual session summaries. Now, we can roll up these session summary records into a time series. We can achieve this by aggregating our sessions table and grouping by the timestamp column.
In this code, we aggregate on a minute-by-minute basis. Because we have the most granular time unit in our table, rolling these up into larger time intervals—like days, weeks, or even months—is much easier. With consumption APIs and parameterized queries, we can dynamically roll up these metrics for any time interval the end user selects on the dashboard. The next section will show you how we did it.
Putting it all together: serving KPIs to our frontend via APIs
Consumption APIs let you write custom business logic for fetching, post-processing, and surfacing data to your applications. This provides significant advantages, allowing you to create powerful APIs that programmatically generate and run queries based on parameter values. We will explore this in more detail in part 2 of this blog series.
We created an API endpoint that wraps the retrieval of our session time series KPIs so our frontend dashboard can simply fetch and render the data without doing any processing. Here’s a simple example of how we implemented this:
Moose creates an API endpoint when you save your file, automatically naming it after the filename (in this case, kpi-timeseries), and maps it to the exported function in the API file. When an HTTP request is made to this endpoint, Moose passes the query parameters provided in the request to the function. The function then processes these parameters and executes a SQL query to fetch the required data.
In this example, the API accepts query parameters for the time interval (step), the start date (from), and the end date (to). Default values are provided for the start and end dates, setting the range to the past week if not specified. Helper functions (getDefaultFrom and getDefaultTo) calculate these default values, converting them to Unix timestamps.
The handle function receives the query parameters and uses the client.query method from ConsumptionUtil to execute the SQL query (no manual db connection necessary). The query aggregates session data into minute intervals (or the specified step), sums up visits, calculates the average session length, total page views, and average bounce rate. It then filters the data based on the specified time range (from and to), groups the results by the time interval, and orders them chronologically.
You’ll find the helper functions we imported from the ConsumptionUtil module of our custom moose-lib package come in handy when building your APIs. Our team consistently utilizes these helper functions and continues to add more as we encounter common patterns in API development. The sql module ensures that Moose properly interprets the template string and securely injects the query parameters.
On the frontend, all we have to do is call our API endpoint, <MOOSE_SERVER_HOST>/consumption/kpi-timeseries, and set our URL query parameters to the values selected by the user in the dashboard.
Wrapping Up
In short, we moved all the gross SQL from the old frontend dashboard codebase to our Moose application, making the frontend code cleaner and the overall project much better structured. The refactor and new code showcases how, thanks to our newest primitives, working with SQL to stage and serve insights from your raw data to your applications is much cleaner and better structured with Moose. We mainly focused on how Aggregations can be especially useful in this process, and gave a straightforward example of one of the APIs powering the new version.
To recap:
- We transformed complex CTE-based queries into streamlined Moose Aggregations.
- We leveraged Aggregations to keep critical metrics fresh and easily accessible.
- We wrapped metric retrieval in a Consumption API for easy data fetching in the frontend.
In the second part of this blog series, I’ll walk through a more intricate example of putting consumption APIs to use on the reports page of the analytics frontend. Here, we will showcase the full realm of what's possible and unique about our APIs. In the meantime, check out the full source code in the GitHub repository and start customizing it to build your own Product Analytics platform.
Want a shortcut? Clone the template with this terminal command:
If you want to catch up on how we got here, I introduced the two newest primitives we added to the MooseJS framework: Aggregations and Consumption APIs in prevoius posts These features make extracting data from your database as easy as ingesting it.
Check out the Moose documentation for more information on how to use Aggregations and Consumption APIs in your own projects.
Stay tuned for part 2!